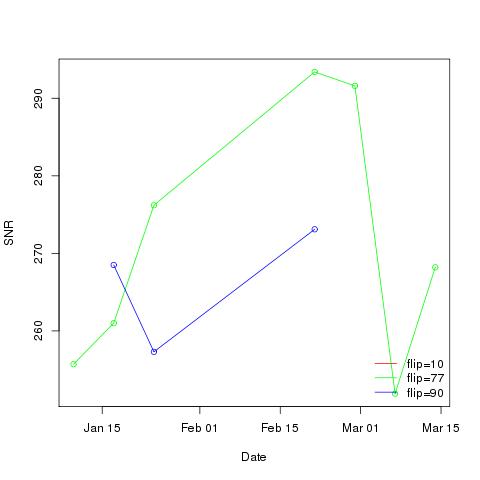
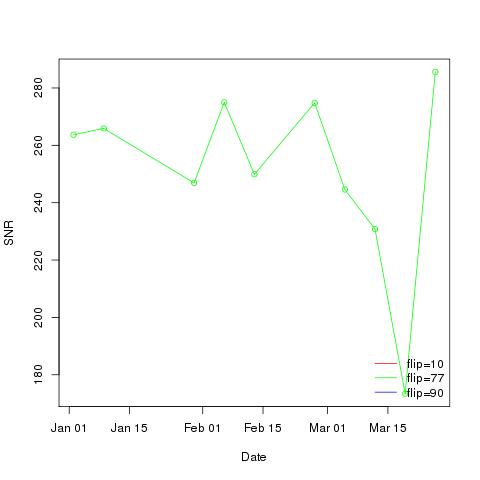
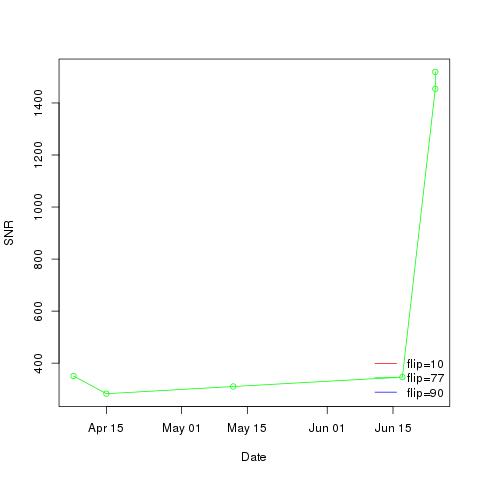
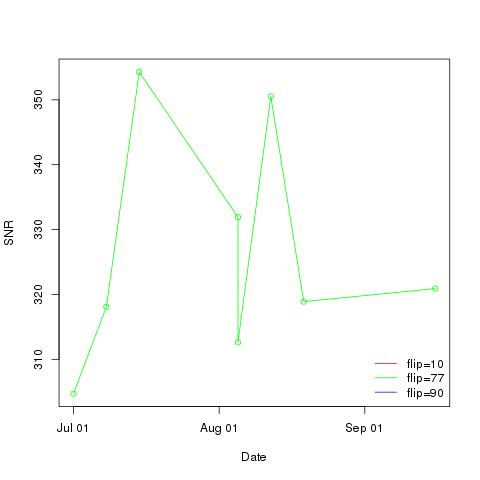
The graphs below reflect quarterly fluctuations in the Signal-to-Noise ratio (SNR) of the Siemens 3T scanner utilized by our lab. SNR is captured with phantom scans conducted before and after each weekly scanning session.
2015
Scans taken from January 2015 to March 2015
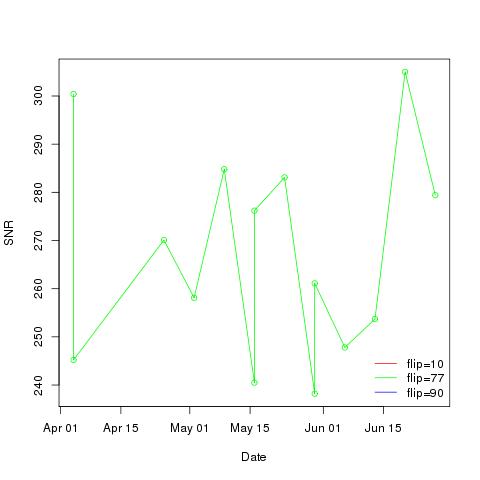
Scans taken from April 2015 to June 2015
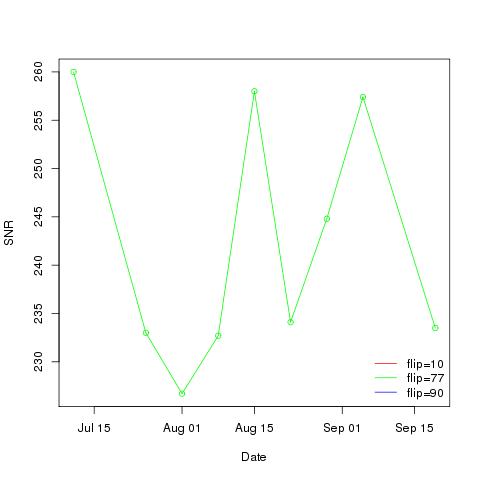
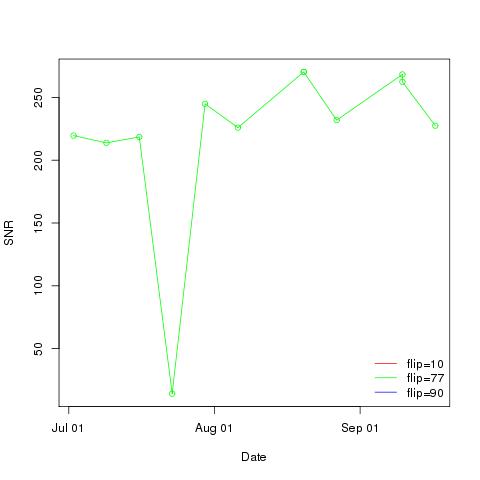
Scans taken from July 2015 to September 2015
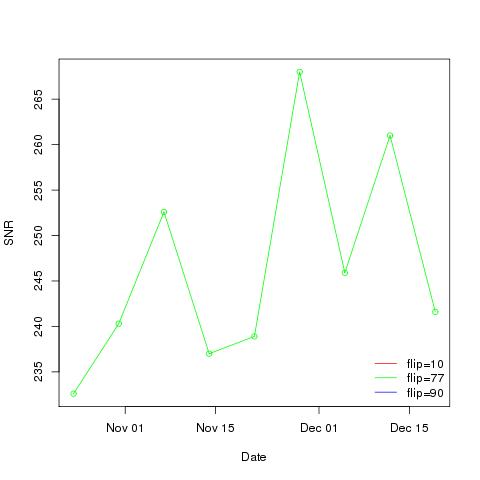
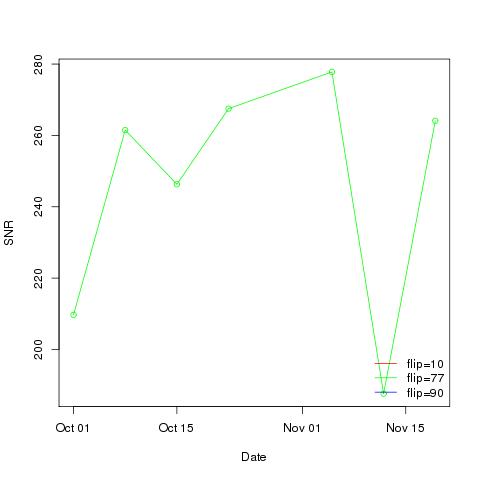
Scans taken from October 2015 to December 2015
2016
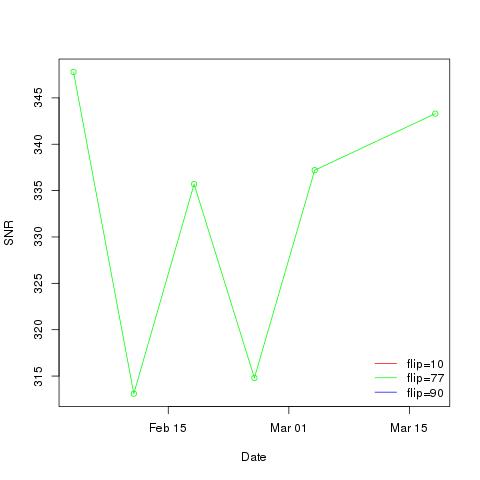
Scans taken from January 2016 to March 2016
Scans taken from April 2016 to June 2016
Scans taken from July 2016 to September 2016
Scans taken from October 2016 to December 2016
*The scanner was closed for updates throughout the month of December; no phantom scans were collected during that time*